matrix_gradient()#
- Derivative.matrix_gradient(func: Callable[[float, float], float], diagonal: bool = False) tuple[csr_array, csr_array]Source#
Derivative matrices based on the gradient of the given function.
This function returns derivative matrices along the parallel and perpendicular directions to the gradient of the given function. The gradient is calculated by the finite central difference using
numpy.gradientat each grid point.Warning
Currently, this method can only be used for a 2-D function, which uses the first and second axis of the grid coordinates, i.e. the grid shape is only allowed to be
(L, M, ndim)or(L, M, N, ndim). and the function use theLandMas the first and second axis respectively.- Parameters:
- Returns:
- dmat_parallel
csr_array The derivative matrix along the parallel direction to the gradient.
- dmat_perpendicular
csr_array The derivative matrix along the perpendicular direction to the gradient.
- dmat_parallel
Examples
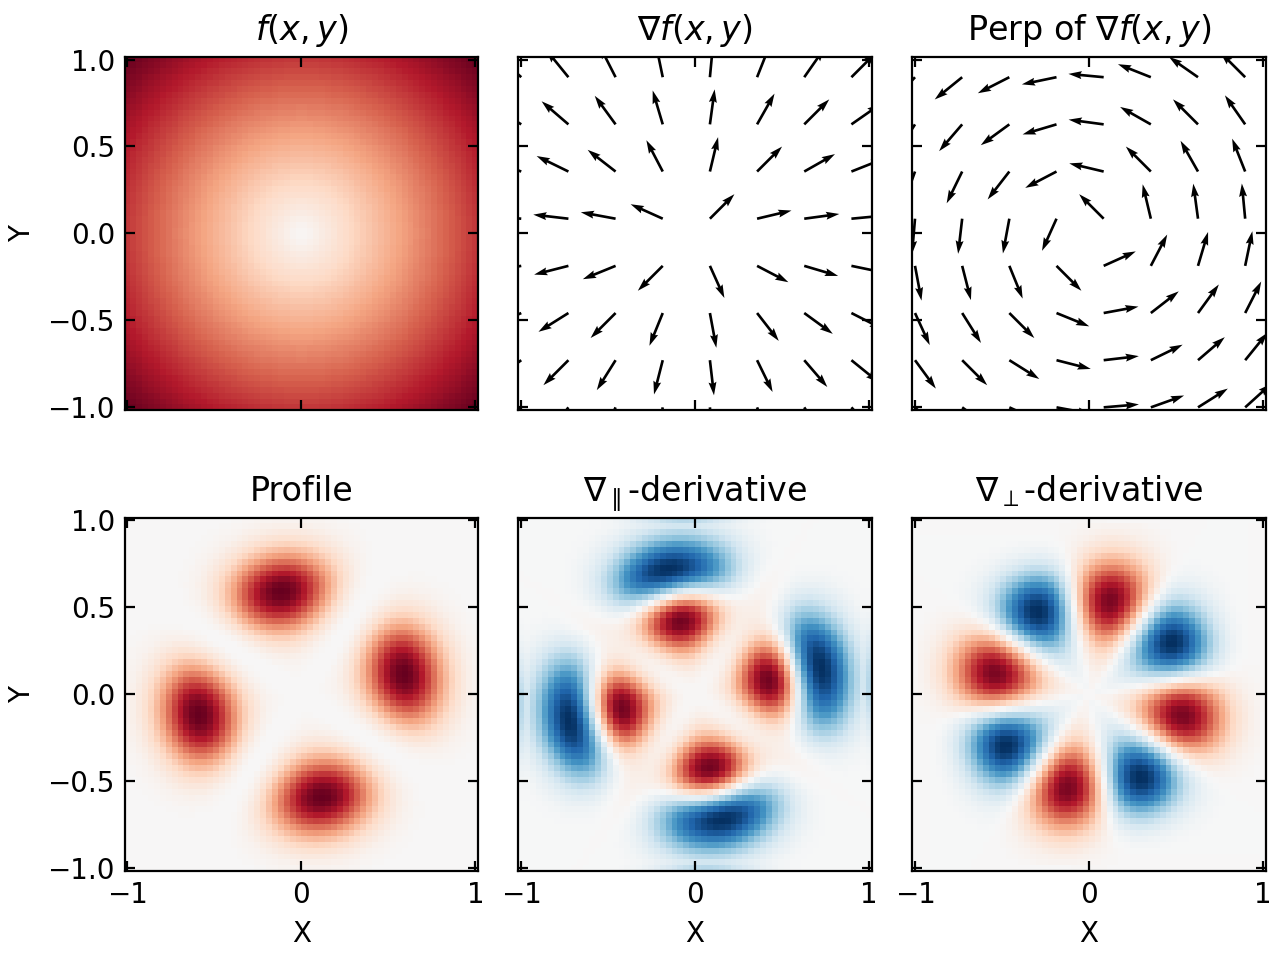
Let us create a sample 2-D profile and apply the derivative matrices along the parallel and perpendicular directions to the gradient of the concentrically monotonically increasing function.
import numpy as np
from matplotlib import pyplot as plt

from cherab.inversion import Derivative

# X-Y grids
x = np.linspace(-1, 1, 60)
y = np.linspace(-1, 1, 60)

# Create voxels center coordinates in (x, y, z)
xx, yy = np.meshgrid(x, y)
centers = np.zeros((x.size, y.size, 1, 3))
centers[:, :, 0, 0] = xx.T
centers[:, :, 0, 1] = yy.T
centers[:, :, 0, 2] = 0

# Create a 2-D profile
indices = np.ndindex(centers.shape[:3])
profile = np.zeros(centers.shape[:3])

CENTER = 0.6
WIDTH = 0.05
PHASE = -np.pi / 4

profile = np.zeros(centers.shape[:3])
radius = np.hypot(xx, yy).T
angles = np.arctan2(yy, xx).T
profile[..., 0] = (1 + np.cos(angles * 4 + PHASE)) * np.exp(-((radius - CENTER) ** 2) / WIDTH)


def scalar_func(x, y):
    """Scalar function to be used in the derivative calculation."""
    return np.hypot(x, y)


# Operate derivative
deriv = Derivative(centers)
dmat_para, dmat_perp = deriv.matrix_gradient(scalar_func)
profile_para = dmat_para @ profile[deriv.grid_map > -1]
profile_perp = dmat_perp @ profile[deriv.grid_map > -1]
profile_para = profile_para.reshape(deriv.grid_map.shape)
profile_perp = profile_perp.reshape(deriv.grid_map.shape)

# Calculate Scalar function values and its gradient
fvals = scalar_func(xx, yy)
grads = np.gradient(fvals, centers[:, 0, 0, 0], centers[0, :, 0, 1])

# Calculate the gradient of the profile
grad_profile = np.gradient(profile[..., 0], centers[:, 0, 0, 0], centers[0, :, 0, 1])
grad_profile = np.hypot(grad_profile[0], grad_profile[1])[:, :, None]

# Plot the profiles
fig, axes = plt.subplots(2, 3, sharex=True, sharey=True, layout="constrained")
axes = axes.ravel().tolist()
for ax, f, title in zip(
    axes,
    [
        fvals[..., np.newaxis],
        [grads[0], grads[1]],
        [-grads[1], grads[0]],
        profile,
        profile_para,
        profile_perp,
    ],
    [
        "$f(x, y)$",
        "$\\nabla f(x, y)$",
        "Perp of $\\nabla f(x, y)$",
        "Profile",
        "$\\nabla_\\parallel$-derivative",
        "$\\nabla_\\perp$-derivative",
    ],
    strict=False,
):
    if "\\nabla f(x, y)" not in title:
        ax.pcolormesh(
            centers[:, 0, 0, 0],
            centers[0, :, 0, 1],
            f[..., 0].T,
            cmap="RdBu_r",
            vmax=np.amax(np.abs(f)),
            vmin=-np.amax(np.abs(f)),
        )
    else:
        ax.quiver(
            centers[:, 0, 0, 0][::8],
            centers[0, :, 0, 1][::8],
            f[0][::8, ::8].T,
            f[1][::8, ::8].T,
            scale=10,
        )
    ax.set_title(title)
    ax.set_xlabel("X") if axes.index(ax) >= 3 else None
    ax.set_ylabel("Y") if axes.index(ax) % 3 == 0 else None
    ax.tick_params(axis="both", which="both", direction="in", top=True, right=True)
    ax.set_aspect("equal")


plt.show()
(
Source code,png,hires.png,pdf)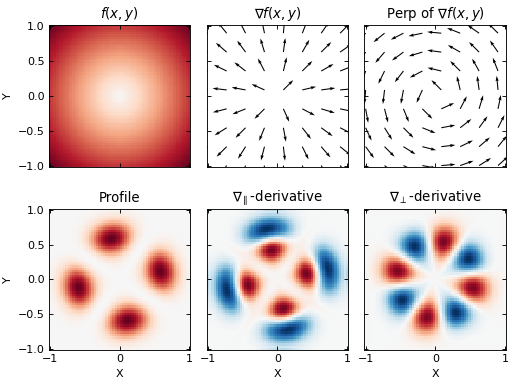